Chapter 8
The Photoelectric Effect
In this card we describe an experience concerning visible light. From its results we will discover some important properties of light that are not accounted for within electromagnetic theory, and that can be explained only by introducing new concepts linked to Quantum Physics.
Description of the experiment.
The photoelectric effect consists in the fact that when light strikes a metal surface, electrons are emitted from it (Fig. 1).

To detect these electrons one can use a system like the one shown in figure 2. We have a glass bulb in which a vacuum has been made. Inside the bulb there is a cathode with a very large surface, and an anode with a minimal surface. When light strikes the cathode, it emits electrons by the photoelectric effect; some of these electrons reach the anode and form a current I that can be measured.

The anode too can emit electrons, but far fewer than those emitted by the cathode, because the cathode surface is much larger; moreover the cathode and the anode are not made of the same metal. Indeed the former is made of a metal that releases electrons very easily, generally an alkali metal, while the latter is made of a metal that releases very few electrons, generally platinum.
The current I that flows in the circuit depends in general on the intensity and on the frequency of the incident light. This current is very weak and can be measured with a good measuring amplifier; however, the aim of our experiment is not to count how many electrons are emitted, so we will not measure the current I.
The aim of the experiment is to determine with how much energy the individual electrons are emitted, as a function of the characteristics of the incident light.
To measure the energy of the emitted electrons we use the system shown in figure 3.

When light is made to strike, a passage of electrons occurs and so the capacitor begins to charge. The voltage that builds up across the capacitor produces an electric field between the cathode and the anode that opposes the motion of the electrons. If the energy possessed by the electrons is sufficient to overcome the potential difference, the current keeps flowing and the capacitor keeps charging. The process stops when the voltage across the capacitor is such that the product , where is the electron charge, is just greater than the energy possessed by the electrons; indeed the product is the energy needed to overcome the potential difference, and when , the electrons, although still being emitted, can no longer reach the anode.
Thus, to obtain the energy with which the electrons are emitted, it will be enough to measure the final voltage reached by the capacitor and use the relation .
Description of the experimental apparatus.
Figure 4 shows a photograph of the bulb that was used to carry out the experiment.
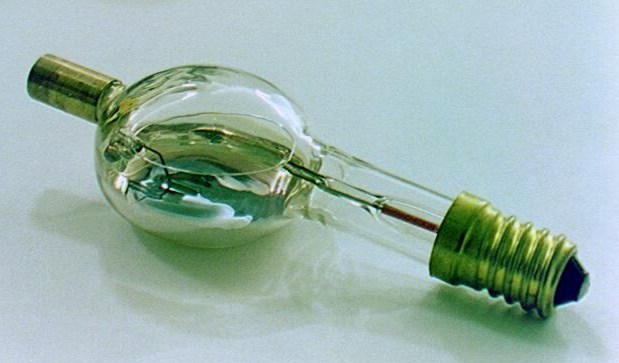
In this bulb the “photocathode” consists of a layer of potassium (potassium is an alkali metal) deposited directly on the inner surface of the glass, while the anode consists of a platinum filament.
Since potassium is very “volatile,” it can happen that some of the potassium forming the cathode transfers and deposits onto the platinum anode; in this case we would have the undesired effect that the anode too could emit electrons. To avoid this drawback a measure has been taken: a current can be passed through the platinum filament, so that it heats up and is purified of the potassium atoms. This “cleaning” operation must be carried out before every experimental trial.
The bulb is mounted on a dedicated support shown in figure 5; this support has a lid with a small window through which the light is passed.
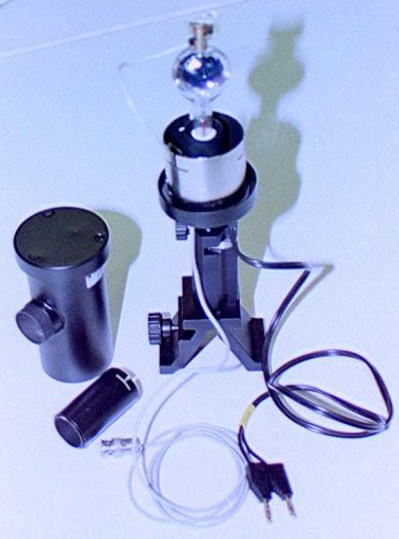
Figure 6 shows a mercury-vapour lamp used to illuminate the photocathode.
To obtain monochromatic light, interference filters are used; figures 7 and 8 show, respectively, the filter for blue and the filter for yellow. We will use four filters in all, corresponding to four wavelengths, and therefore to four frequencies:
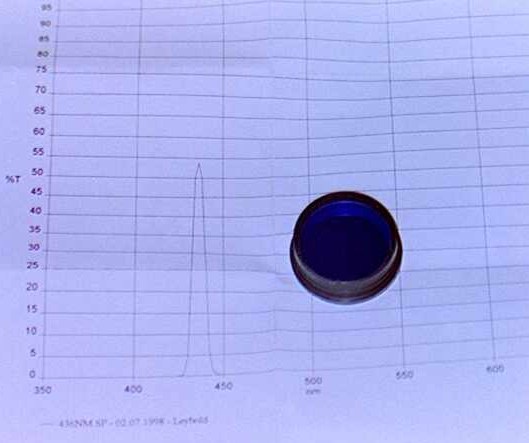
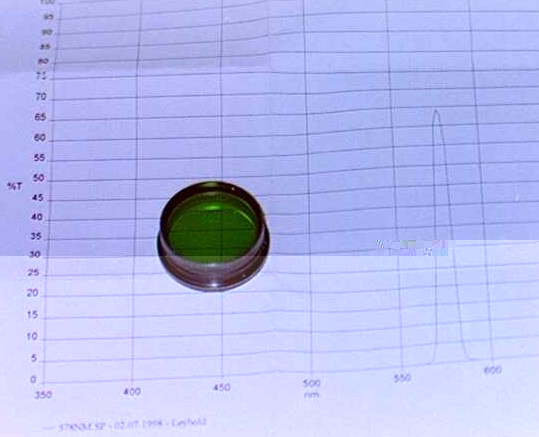
Figure 9 shows the support for these four filters, which also includes an iris diaphragm. By rotating the filter “wheel” one can select a filter and thus adjust the wavelength of the incident light; by opening and closing the diaphragm, instead, one can adjust the intensity of the incident light.
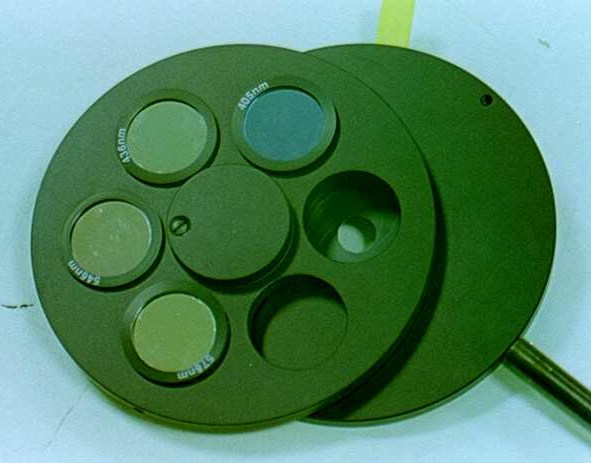
Figure 10 shows the optical bench assembled; from left to right we have: the mercury-vapour lamp, an iris diaphragm, a converging lens with a focal length of 50 mm, the support for the four filters and for another iris diaphragm and, finally, the support holding the bulb, shielded from external light rays.
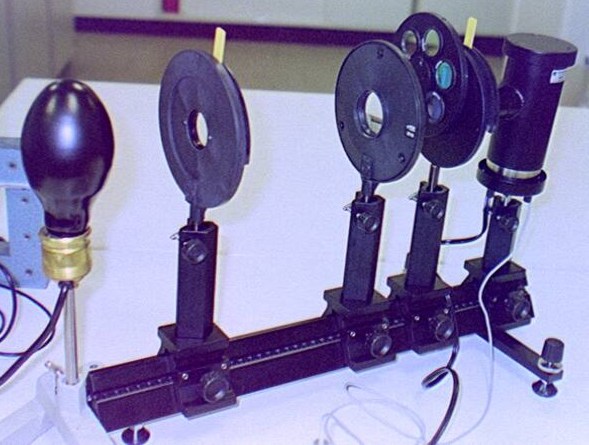
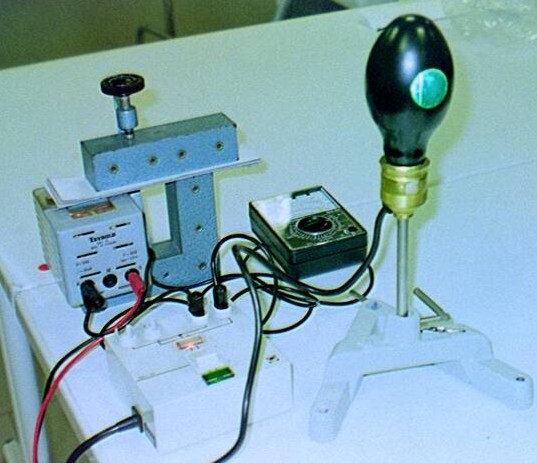
Figure 11 shows the entire experimental apparatus in operation. At the bottom we see the measuring instruments; on the left is the capacitor. In the centre there is an impedance buffer and on the right an ordinary voltmeter.
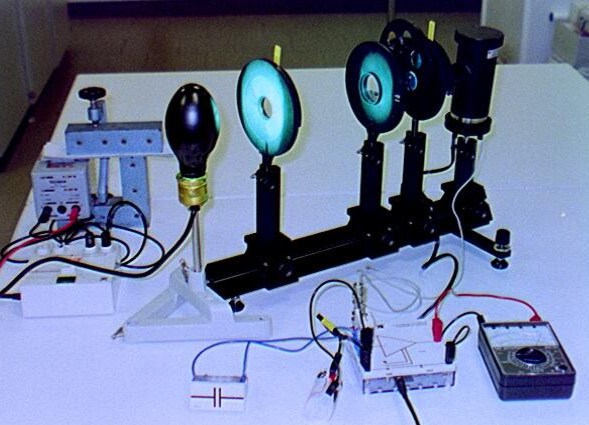
To measure the voltage across the capacitor, an ordinary voltmeter cannot be used directly, because the internal impedance of a voltmeter is too low and therefore provides a path for the photoelectric current (Fig. 12). To overcome this difficulty an impedance buffer is used, as sketched in figure 13. The impedance buffer is an electronic instrument that has a very high internal impedance on the capacitor side — much higher than that of an ordinary voltmeter — and that reproduces at its output the same voltage measured at its input, allowing the measurement to be made without difficulty.


▶Try the simulated laboratory · The photoelectric effect→
Experimental results.
First of all, it was observed that the emission energy of the electrons does not depend on the intensity of the incident light. Indeed, by increasing the light intensity — adjusting the dedicated iris diaphragm — the time needed to charge the capacitor was seen to increase, which means that the current increased, that is, the number of electrons emitted per unit time; nevertheless the final voltage reached by the capacitor remained unchanged.
By varying the frequency of the incident light, instead, a variation of the final voltage was obtained, and hence a variation of the energy possessed by the emitted electrons. The table below reports the recorded values of the energy as a function of the frequency of the incident radiation.
| Colour | Frequency (1014 Hz) | Energy (eV) |
|---|---|---|
| Yellow | 5.19 | 0.44 |
| Green | 5.49 | 0.54 |
| Blue | 6.88 | 1.05 |
| Violet | 7.41 | 1.24 |

One observes that the points lie on a straight line (fig. 14) with a slope of ; one can note that changing the bulb for another containing a different metal does not change the slope of the line, so the slope does not depend on the type of metal; the slope obtained with more precise measurements is . Moreover, although we did not carry out the corresponding measurements, one can observe that for frequencies lower than the voltage is zero, which means that no electrons capable of charging the capacitor are emitted; this threshold frequency changes if the metal of which the photocathode is made is changed.
Interpretation of the results.
These results cannot be explained on the basis of classical electromagnetic theory. Indeed, from the classical point of view the energy of an electromagnetic wave does not depend in any way on the frequency, but depends on the square of the amplitude. With our experiment, instead, we have verified that the energy of the emitted electrons does not depend on the amplitude of the incident wave, but depends on the frequency.
The first to interpret these results correctly was Albert Einstein, in a work he presented in 1905, before the formulation of Quantum Mechanics; for this work he was awarded the Nobel Prize in Physics in 1921.
Einstein thought that light consisted of a beam of particles called photons, and that each particle carried a certain energy proportional to the frequency according to the formula (where h is the same Planck constant that appears in the Schrödinger equation!); in this view the intensity of the light is proportional to the number of photons passing per unit time, multiplied by the energy carried by each single photon.
According to this interpretation, when a photon strikes an electron it transfers its energy to it; the electron can then overcome the potential barrier that binds it to the metal and, once outside, will have an energy equal to that given to it by the photon minus the energy it had to spend to overcome the potential barrier ; thus it will emerge with an energy . This formula is in perfect agreement with the experimental results. If the frequency of the light is too low and one has , then the electron, even though it has received the energy from the photon, will not have enough of it to overcome the potential barrier, and so cannot be emitted.
The photon is a particle that travels at the speed of light, so to study it one must use equations that are consistent with the Theory of Relativity.
The Schrödinger equation was formulated in the fourth card, and we derived it starting from the condition that it had to be consistent with Newton’s classical equation; but that equation is not consistent with the Theory of Relativity, so neither is the Schrödinger equation. Therefore, unfortunately, the Schrödinger equation cannot be applied to the photon.
Relativistic Quantum Mechanics lies outside this work; as the result of this card we will keep in mind Einstein’s relation for the energy of photons .
Remark: in the Theory of Relativity, for every particle one can compute the energy and the momentum according to the formulas and . For photons we have , therefore:
substituting the formula for E, we have
Thus we have recovered the De Broglie relation for photons as well.