Chapter 13
Atomic Emission Spectra
The energy of the hydrogen atom is quantised, and the formula for the levels is derived in the card on further developments. We now ask what happens when an atom passes from a higher energy state to a lower one.

To understand this phenomenon one must study Relativistic Quantum Mechanics; for now, however, it is enough to know two things:
first, that when an atom receives a certain amount of energy from an external system and moves into an “excited” state — that is, a state of higher energy — it does not remain long in this condition but “decays” to a lower-energy state in a very short time;
second, when the atom decays to a lower-energy state, it emits a photon whose energy equals the difference .
From Einstein’s relation we can determine the energy of a photon by measuring the frequency of the associated electromagnetic wave. Putting these facts together, then, we have a method for determining the energy differences between the various states of an atom.
Principle of the experiment.
The substance to be analysed is taken and brought to the gaseous state; in this way we obtain a set of atoms that are independent of one another.
Energy is supplied to these atoms so as to “excite” them, that is, to raise them to a higher energy state.
The light emitted by the atoms is collected and the various frequencies of which it is composed are measured.
From Einstein’s relation the various energy gaps of the atom under study are derived.
To measure the frequencies one can use a diffraction grating, which produces the first maximum at an angle that depends on the frequency of the incident light:
If we send a beam of the light produced by the atoms towards a diffraction grating (Fig. 1), beyond the grating the beam is separated into several monochromatic parts. Each part is deflected by a different angle; by measuring the diffraction angles we determine the frequencies of which the beam is composed.
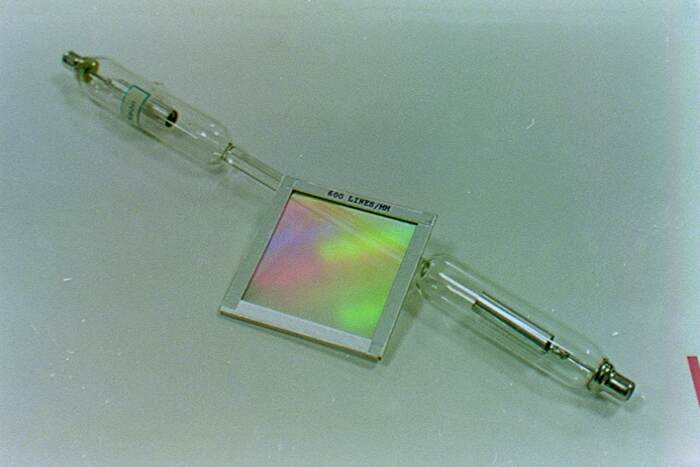
The simplest atom, which also has the simplest spectrum, is the hydrogen atom. The energy levels predicted by the theory for the hydrogen atom are given by the formula and are plotted in figure 2; figure 3 shows all the possible energy jumps from a higher level to a lower one (the possible energy jumps are of course infinite in number; we have shown only a few).


One can distinguish several series of jumps corresponding to several series of wavelengths. The Lyman series lies in the ultraviolet; the Balmer series — the first to be observed — lies in the visible; the Paschen series lies in the infrared. To observe the Lyman and Paschen series one must use particular kinds of photographic plates, whereas the Balmer series can be observed directly by eye.
Experimental apparatus.
The atoms that can be analysed most easily are those forming a gas; indeed these atoms are already in the gaseous state and are, moreover, very easy to excite. The photograph in figure 4 shows four small glass tubes containing four different gases — oxygen, neon, argon and nitrogen — at a pressure of about atmospheres. At the ends of these tubes are two electrodes; applying a voltage of about 1000 V to these electrodes produces an electrical discharge in the gas capable of exciting the atoms.
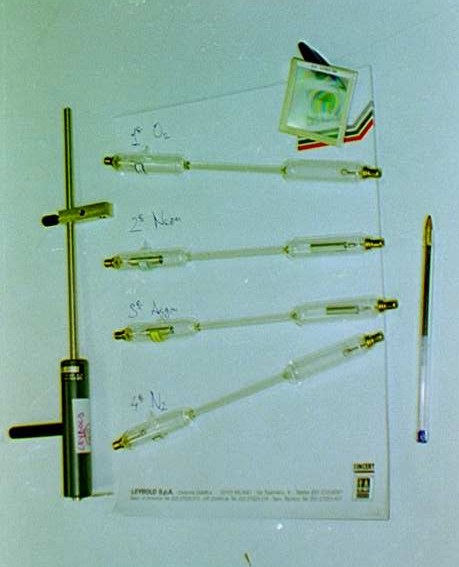
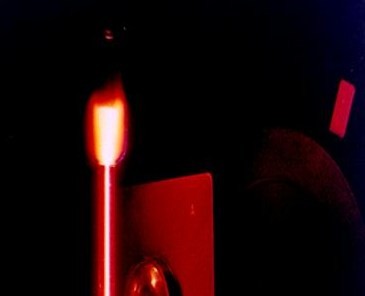
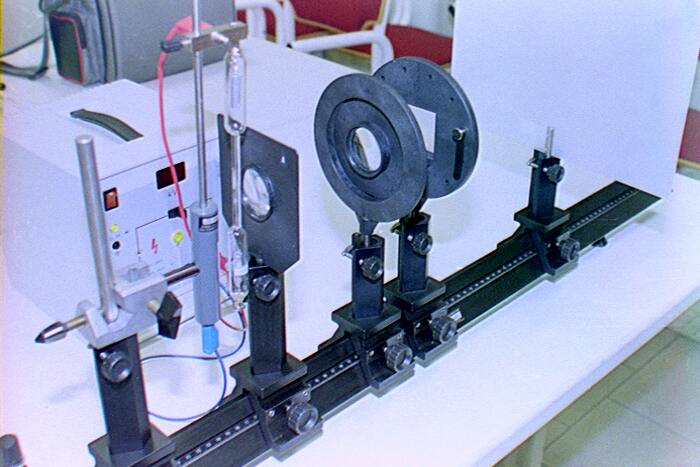
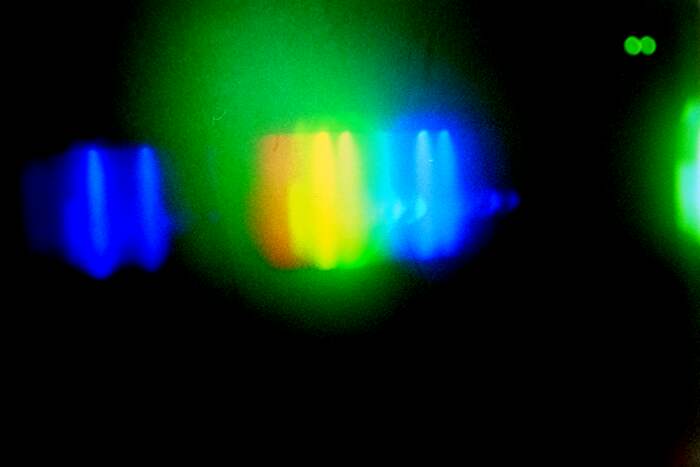
Figure 5 shows the neon tube switched on. Figure 6 shows the optical bench used to focus the light beam; from left to right we have: the neon tube, two converging lenses that focus the beam, a diffraction grating and a white screen. Figure 7 shows the image obtained on the screen: the lines corresponding to the different colours are visible.
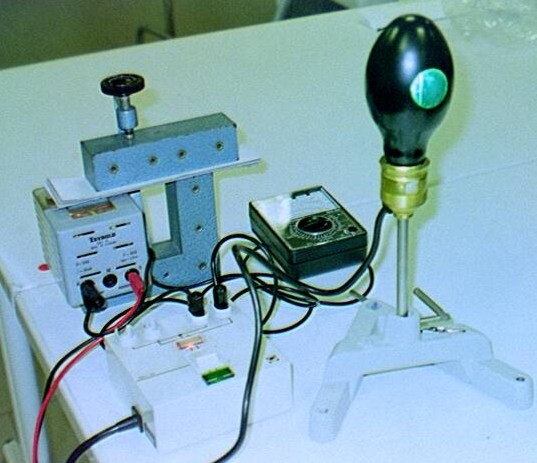
Besides discharge tubes, more efficient systems can also be used to excite the atoms; figure 8, for example, shows a mercury-vapour lamp that emits a much more intense light than that emitted by the discharge tubes.
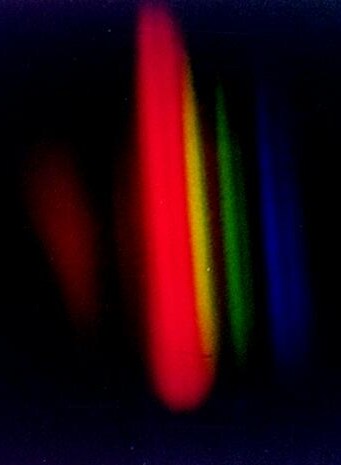
Figures 9, 10 and 11 show the spectral images obtained from the mercury-vapour lamp.
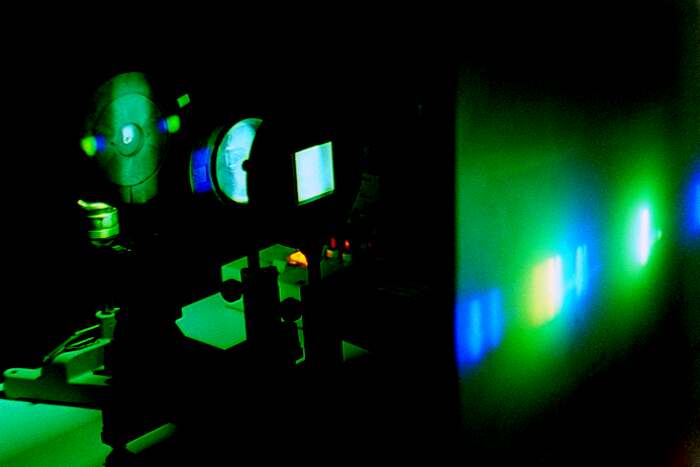
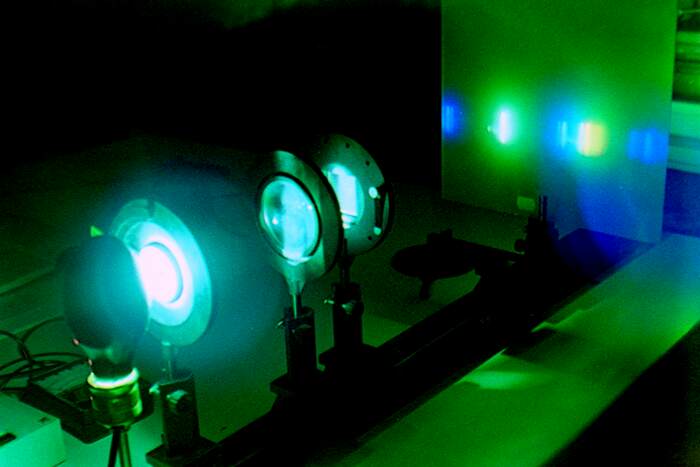
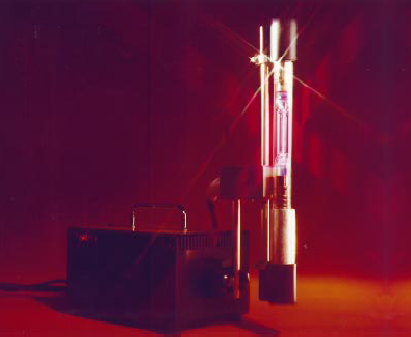
To obtain the light emitted by hydrogen a special lamp is used, called the Balmer lamp, shown in figure 12.
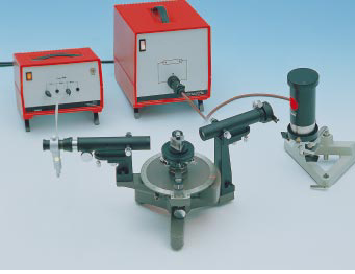
To carry out measurements with a certain degree of precision one must use an optical system called a goniometer spectrometer, shown in figure 13. The measurements made in this way are in perfect agreement with the theoretical results obtained from the Schrödinger equation.
▶Try the simulated laboratory · Measure the emission spectra→