Chapter 6
The Rutherford Experiment
The experiment of this card will let us discover an important feature of atomic structure. We will see that the volume occupied by an atom is almost entirely empty space! For example, in a crystal (fig. 1) the volume occupied by an atom can be measured in various ways, for example by X-ray diffraction, and the result is a diameter of the order of 1 Å (1 Ångström = 10⁻¹⁰ m), but this volume is practically empty and only a tiny central part is occupied by matter. The particle occupying this centre is called the nucleus and contains almost all the mass of the atom. The “empty” part is the space in which the electrons of the atom move, which — depending on the type of nucleus — can range from one to a little more than a hundred.

In the final part of the card we will show a method that will let us determine the positive charge contained in the nucleus; in this way we will also indirectly measure the number of electrons belonging to the atom.
Before describing the experiment it is worth spending a few lines to introduce the phenomena of radioactivity and to describe the α particles. Here we clarify only the bare minimum needed to understand the experiment.
Radioactivity and α radiation.
Some materials spontaneously emit various types of high-energy particles, without being stimulated in any way from outside. These materials are called radioactive, and the beams of emitted particles are called radiations.
The radiations can be observed with various types of detectors, more or less complicated. The most sophisticated detectors also allow the type of particles to be distinguished and their physical characteristics to be determined.
The particles used in Rutherford's experiment are called α particles; they have a mass practically equal to that of the helium atom and an electric charge equal to twice that of the electron. In essence, an α particle is the nucleus of a helium atom.
The emission speed of the α particles depends on the radioactive material used, and can be measured with deflection experiments in electric and magnetic fields similar to those described in the card on experiments with electrons.
Description of the experimental apparatus.
Figure 2 shows a diagram of the apparatus.

We have a radioactive source called Am241 that emits α particles. The beam is collimated by a slit, after which it strikes a thin gold foil 2 μm thick; the particles cross the foil and are scattered. Finally we have a detector that can be placed at various angles ϑ and that measures the distribution of the scattered particles.
The experiment is carried out under vacuum (pressure <1 mBar = 100 Pa) to allow the α particles to travel their path without colliding with the molecules of the air.
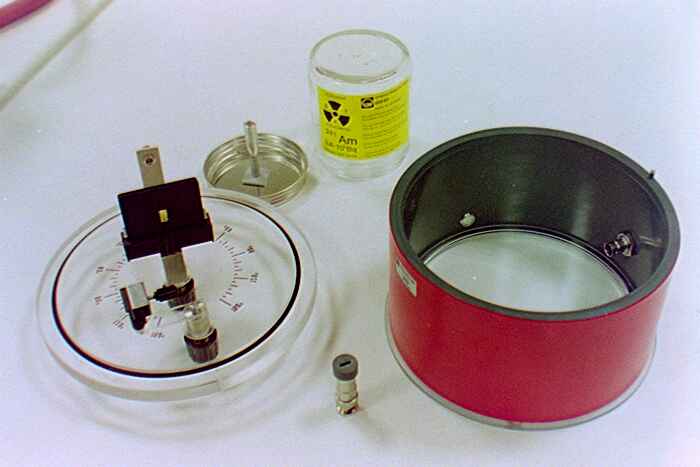
Figure 3 is a photograph of the radioactive source; the Am241 is placed on the head of a metal support and is kept in a glass container for safety reasons.
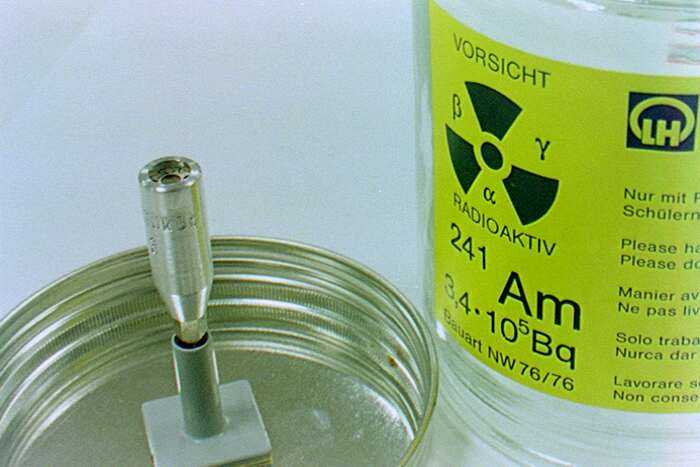
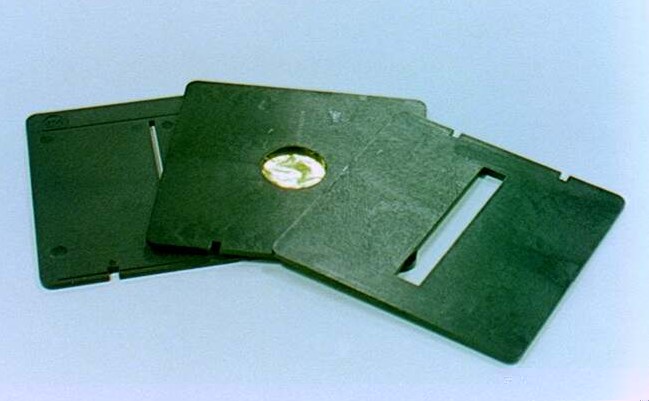
Figure 4 shows the gold foil, 2 μm thick, mounted on a plastic support; two collimating slits are also visible — the one behind on the left is 1 mm wide, while the other in front on the right is 5 mm.
The detection system consists of a silicon detector connected to a measuring amplifier; the photograph in figure 5 shows the detector and the amplifier.
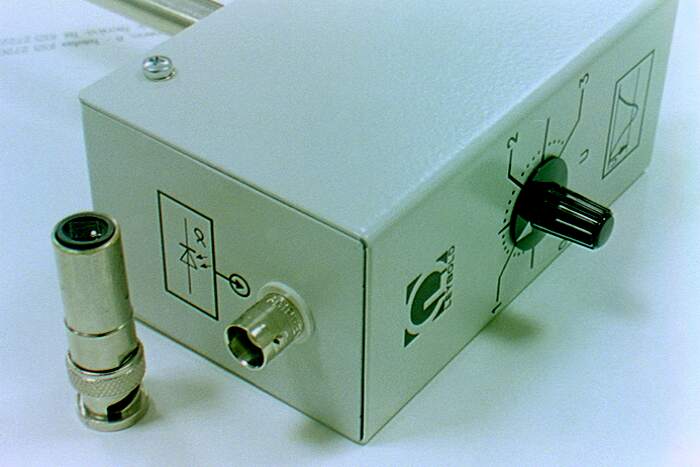
The detector consists of a silicon two-terminal device with its own electrical resistance; when the sensitive surface is struck by an α particle with sufficient energy, the electrical resistance drops for an instant and then returns to its original value (fig. 6), through a mechanism that belongs to semiconductor physics and that we do not deal with here. The measuring amplifier “senses” the change in resistance and amplifies the signal, generating an amplified pulse with the same shape as the one received at the input. The photograph in figure 7 shows the amplifier from the side of the output terminals: from the left terminal one can take the amplified pulse with its original shape, while from the right terminal one obtains a squared pulse built as figure 8 shows; the level of the voltage U can be adjusted with a knob located on the upper part of the amplifier. The squared pulse is fed to a digital counter which, by counting the number of pulses, counts the number of α particles that reach the detector. Figure 9 shows a photograph of the whole experimental apparatus: the cylinder on the left is the chamber containing the radioactive source, the gold foil and the detection sensor. The chamber is connected to a reciprocating pump that produces the vacuum; moreover, from the chamber runs the cable connecting the sensor to the amplifier shown in the centre, which in turn is connected to the digital counter seen on the right. The amplifier is powered by a 10 V DC power supply seen in the centre behind the amplifier.


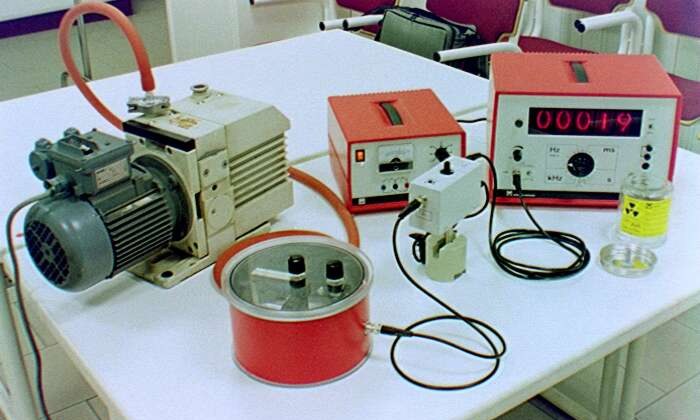
In the photograph in figure 10 the chamber is seen open with all its components — the radioactive source, the sensor and the gold foil already mounted on its support; figure 11 shows the chamber closed.
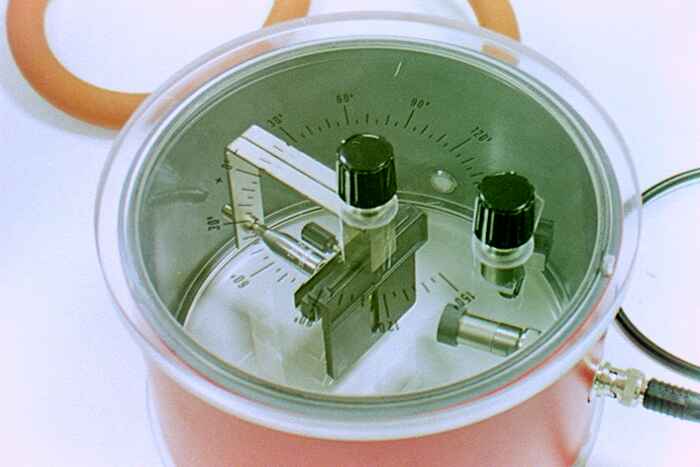
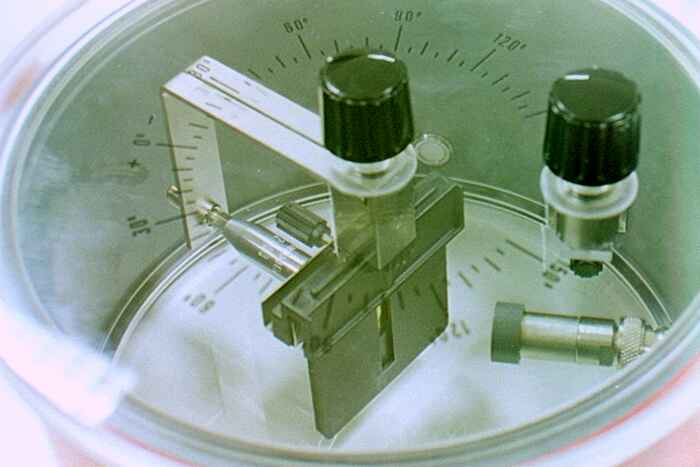
In the initial diagram (fig. 2) we saw that the radioactive source and the gold foil were fixed while the detector could rotate; in our system it is the opposite: the detector is fixed to the wall of the cylinder, while the gold foil and the radioactive source are mounted on a rotating support — obviously the two solutions are equivalent. In figure 11 the knob on the right serves to rotate a support that is not used in our experiment, while the knob in the centre is the one that lets us rotate the support of the radioactive source and the gold foil.
Carrying out the experiment and experimental results.
First of all the cylinder must be opened and the various elements arranged — the radioactive source, the slit, the gold foil and the detector. One can choose the 1 mm slit or the 5 mm one: in the first case more precise measurements are obtained, in the second faster measurements.
If the cylinder is under vacuum, air must first be let in by opening the dedicated valve, and only then can the lid be removed. If the gold foil is already mounted inside the cylinder, care must be taken not to let the air in too abruptly, otherwise the foil could tear because of the violent pressure variations.
After arranging all the elements, the cylinder is closed and the pump is switched on for about five minutes; meanwhile the detector is connected to the amplifier and the amplifier to the digital counter, and the amplifier is powered with a 10 V DC generator.
After switching off the pump, the counter and the amplifier are turned on, and the threshold voltage U (fig. 8) is set to about 0.5 V with the dedicated knob on the amplifier.
At this point the measurements can be taken. The detection angle ϑ is set with the knob on the cylinder's cap, the counter is zeroed, and the counter and a pocket stopwatch are started at the same time. After a few minutes, when a sufficient number of pulses has been counted, the counter and the stopwatch are stopped at the same time; in a table one records the angle ϑ, the number of pulses counted and the detection time. It is advisable to count at least about twenty pulses to reduce the statistical error.
The table below shows a series of measurements taken with the 1 mm slit; in the fourth column the number of pulses per unit time is reported. Figure 12 plots as a function of ϑ; one observes that the curve is shifted to the left by about 1.2°, which simply means that the direction of the beam was not perfectly aligned with the zero of the goniometer.
| ϑ (°) | N | Δt (s) | N/Δt (s⁻¹) |
|---|---|---|---|
| 0 | 3059 | 120 | 25.5 |
| 2.5 | 1736 | 120 | 14.5 |
| 5 | 868 | 120 | 7.23 |
| 10 | 84 | 120 | 0.7 |
| 15 | 20 | 125 | 0.16 |
| 20 | 20 | 333 | 0.06 |
| 25 | 20 | 526 | 0.038 |
| 30 | 20 | 1000 | 0.02 |
| -1.2 | 3201 | 120 | 26.7 |
| -2.5 | 3089 | 120 | 25.7 |
| -5 | 1796 | 120 | 15 |
| -7.5 | 873 | 120 | 7.27 |
| -10 | 268 | 120 | 2.23 |
| -15 | 50 | 120 | 0.417 |
| -20 | 20 | 200 | 0.1 |
| -25 | 20 | 286 | 0.0699 |
| -30 | 20 | 1053 | 0.019 |

▶Try the simulated laboratory · α-particle scattering→
Interpretation of the results.
Knowing that the gold foil is 2 μm thick and that a gold atom has a diameter of about 1 Å = 10⁻⁴ μm, we can calculate that the foil is about twenty thousand atoms thick. Moreover we know that a gold atom is about fifty times heavier than an α particle.
On the basis of this information, if we suppose that atoms are like solid little spheres and try to imagine the collision between an α particle and the gold foil (Fig. 13)

we cannot understand how it is possible for the particle to cross the foil. Under these conditions the radiation should be blocked, and yet experimentally it has been observed that almost all the particles cross the wall with a rather small deflection (<10°).
The experimental results can be explained by thinking that the atom is structured more or less like a small planetary system, with a very heavy and very small nucleus at the centre, and with a set of electrons moving in an orbital space similar to a cloud. In a later card we will see the energy levels of such a system, obtained from the Schrödinger equation. For now we pause to observe how this hypothesis agrees with the experimental results.
First of all, on the basis of the atomic model we have hypothesised, we can understand why the gold foil is so transparent to α rays (fig. 14); indeed, since the nuclear dimensions are very small, even if there are twenty thousand nuclei in a row, it is very improbable that a head-on collision occurs.

In the next card we will generalise the Schrödinger equation to three dimensions and calculate the probability distribution for the scattering angle ϑ, using the planetary atomic model. We will then compare the result with our measurements.