Chapter 2
Electron Diffraction
In this card we describe an experiment in which the electron shows properties very different from those a normal classical particle should have. We will see that a beam of electrons “fired” from an electron gun does not always behave like a beam of particles; indeed, in this experiment it will behave like a wave.
Description of the experiment and classical predictions.
Figure 1 shows a schematic of the experiment. We have a beam of electrons striking a thin foil of crystalline material; the electrons that cross the foil are detected on a phosphor screen.

The structure of a crystal will be studied later, in the card on Rutherford's experiment. We will see that a crystal consists of an aggregate of atomic nuclei arranged in a three-dimensional lattice (Fig. 2), with a more or less complicated geometry. We will also see that the distance between two adjacent nuclei is much larger than the diameter of the nucleus.

From a classical point of view we expect that an electron, when it crosses a crystal, is deflected by a certain angle and in a certain direction that depend on the initial motion of the electron and on the orientation of the crystal (Fig. 3). A beam is made of many electrons, each with dynamical conditions slightly different from every other. So, beyond the crystal, we will have a spreading of the beam because not all the electrons are deflected by the same angle.

The deflection angle δ is a random variable, that is, a quantity that can take different values, each with a certain probability. The probability distribution for the variable δ can be calculated on the basis of the corpuscular model of the electron, and on this model we expect a bell-shaped curve like the one shown in figure 4. But, as we will see, the distribution of electrons actually detected on the screen does not correspond to this classical prediction.

Description of the experimental apparatus.
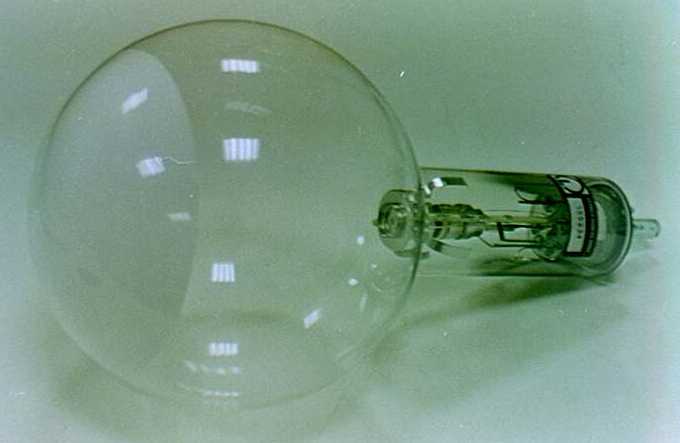
The electron gun, the crystalline-material foil and the phosphor screen are mounted inside an evacuated glass bulb.
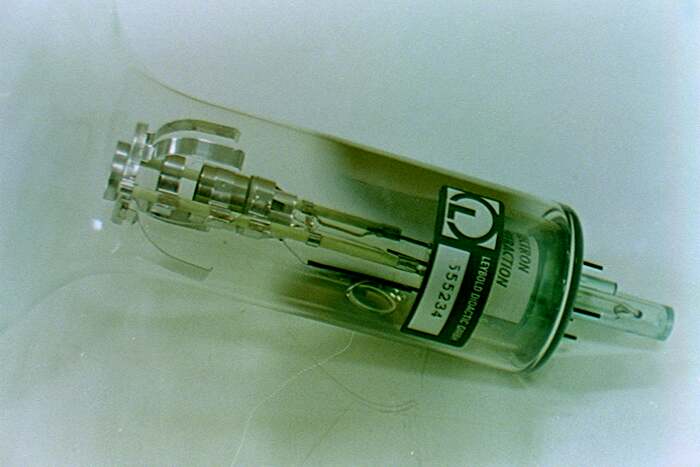
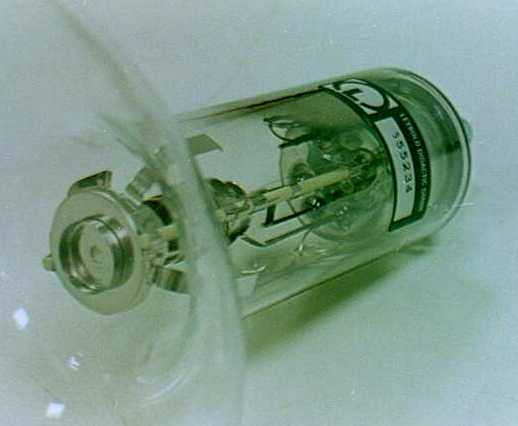
Figure 5 shows a photograph of this bulb, while figures 6 and 7 show the electron gun in detail.
A diagram is shown in figure 8.

As can be seen from the photograph in figure 6 and the diagram in figure 8, the crystal foil is placed directly on the final stage of the electron gun.
The system is powered as shown in figure 9.

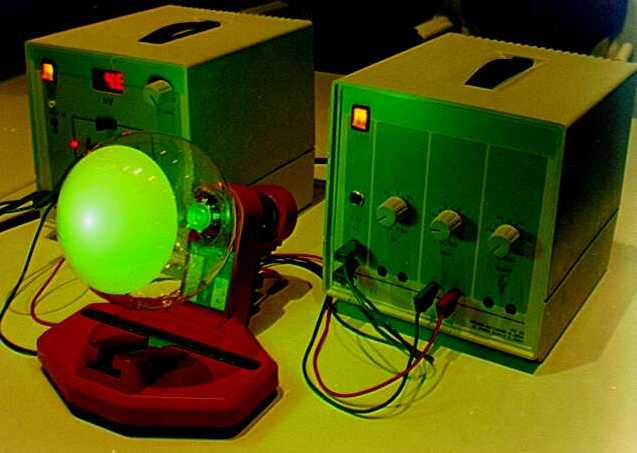
Two power supplies are used: one for the high voltage of 0÷5000 V and one for the low voltages of 6 V and 0÷50 V. The photograph in figure 10 shows the whole system powered up. On the left is the high-voltage supply, and on the right the low-voltage supply. The bulb is mounted on a universal support.
Experimental results.
The photograph in figure 11 shows in detail the image obtained on the screen.
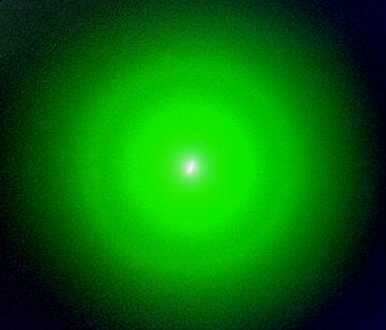
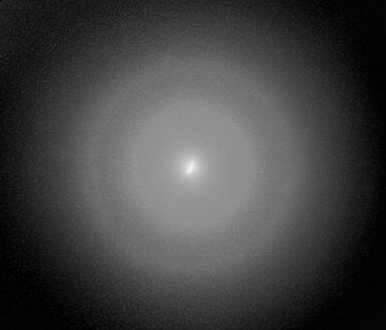
One observes a central spot and two concentric circles. The probability distribution for the variable δ deduced from this image is the one shown in figure 12.

If we vary the accelerating voltage, the radii of the two circles are seen to change, that is, the deflection angles δ₁ and δ₂ change.
The following measurements were taken:
| V (Volt) | δ₁ (rad) | δ₂ (rad) |
|---|---|---|
| 2500 | 0.115 | 0.199 |
| 3000 | 0.105 | 0.182 |
| 3500 | 0.097 | 0.168 |
| 4000 | 0.091 | 0.157 |
| 4500 | 0.086 | 0.148 |
Figure 13 shows two plots of the measurements taken: one with the voltage V on the ordinate, the other with the inverse square root of the voltage . From the second plot one can observe that the angles δ₁ and δ₂ are directly proportional to the inverse square root of the voltage: and .


Interpretation of the results.
The image obtained on the screen cannot be explained if one thinks the electron gun fires a beam of classical material particles. It can be explained, instead, if one thinks the gun generates a wave similar to that produced by a LASER, but not electromagnetic. Indeed, according to this idea, the image formed on the screen can be interpreted as a diffraction pattern produced by the crystal lattice of the graphite contained in the foil placed in front of the beam.
Graphite has a planar crystal structure shown in figure 14. Within this lattice one can identify several sublattices of equally spaced parallel lines (Fig. 15). The diffraction due to the original lattice is approximately equal to the superposition of the diffractions produced by the individual sublattices of equally spaced parallel lines (Fig. 16).


In the crystal one identifies two types of parallel-line lattices, one with spacing , and the other with spacing . So, when the beam crosses the lattice, we have two first-order diffraction angles: corresponding to and corresponding to .
The circles in figure 11 form because the foil is made of many randomly oriented crystals:
Each single crystal forms an image made of a few spots (Fig. 17):

The superposition of many images rotated by a random angle forms the circles (Fig. 18):

The fact that the first-order diffraction angles depend on the accelerating voltage applied means that the wavelength of the beam depends on the voltage.
Wave–particle duality and the De Broglie relation.
Does the electron gun fire a burst of particles, or does it generate a beam of waves? The experiment described in this card leads us to think it is a beam of waves, but other experiments lead us to the opposite answer. The result is that neither hypothesis is really correct: the electron is neither a wave nor a particle.
The electron has a corpuscular behaviour, in the sense that when it interacts with other systems it produces discrete effects, in packets. For example, in Millikan's experiment one observed the effects of a single electron or of a few electrons at a time; indeed one observed a discrete charge, in packets. There are also other experiments that show the corpuscular nature of the electron, but we will describe them later.
The electron also has a wave behaviour, because it can produce diffraction. It is also possible to show the interference of electrons, similar to that produced by light with two slits, but the experimental apparatus needed to observe this phenomenon includes an electron microscope, and it is rather difficult to find a teaching laboratory equipped with such a system.
We conclude that when we think of an electron we should imagine a material particle accompanied by a wave, or a wave accompanied by a particle. As we have said, it is neither one nor the other; for now let us concentrate on what should be the wave. The wavelength is given by a formula found by De Broglie: , where p is the momentum of the particle, λ is the wavelength and h is the Planck constant. This formula can be confirmed with our experiment and has a very general validity, in the sense that it holds for all types of particle — electrons, atomic nuclei, particles of light, and so on. The following table reports the experimental measurements we took; also reported are the wavelength , calculated from the diffraction formula , and the momentum , calculated from the energy equation . In the last column we report the product which, as one can see, is practically constant.
| V (Volt) | p (10⁻²³ kg·m/s) | δ₁ (rad) | δ₂ (rad) | λ (10⁻¹¹ m) | pλ (10⁻³⁴ J·s) |
|---|---|---|---|---|---|
| 2500 | 2.7 | 0.12 | 0.20 | 2.4 | 6.5 |
| 3000 | 3.0 | 0.11 | 0.18 | 2.2 | 6.6 |
| 3500 | 3.2 | 0.097 | 0.17 | 2.1 | 6.7 |
| 4000 | 3.4 | 0.091 | 0.16 | 1.9 | 6.5 |
| 4500 | 3.6 | 0.086 | 0.15 | 1.8 | 6.5 |